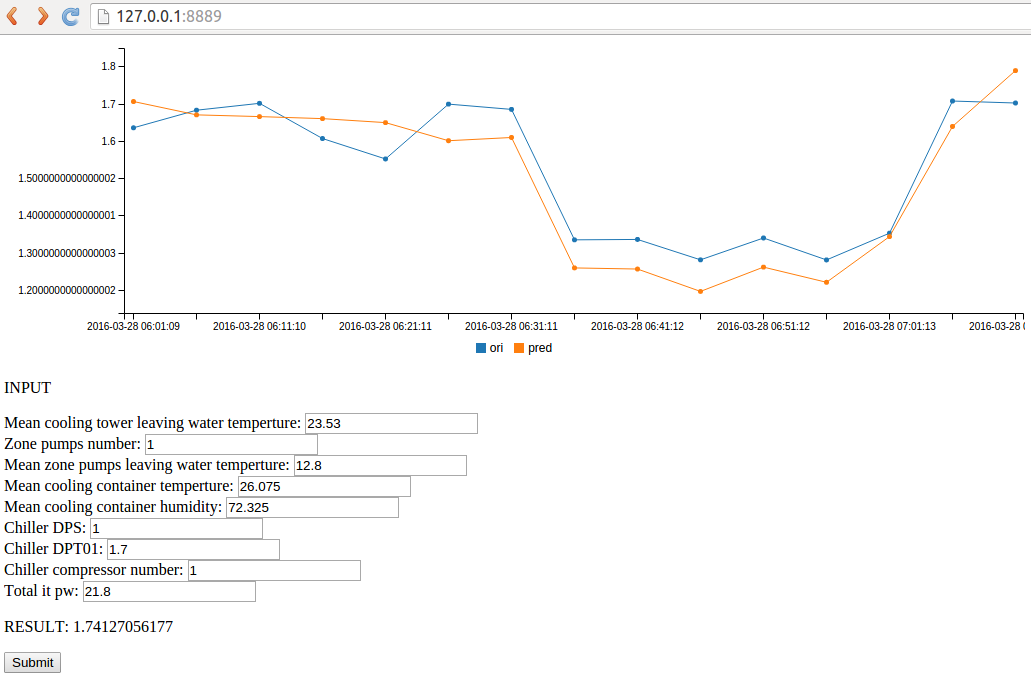
Time Series Data Visualization
Prerequisite : django , c3.js , influxDB
Based on Ubuntu 14.04 64bit
django
- Insatll virtualenv , pip….
- virtualenv –distribute myApp
- pip3 install django
- django-admin startproject myWebsite
- python3 manage.py runserver 127.0.0.1:8889
influxDB
- curl -sL https://repos.influxdata.com/influxdb.key | sudo apt-key add -
- source /etc/lsb-release
- echo “deb https://repos.influxdata.com/${DISTRIB_ID,,} ${DISTRIB_CODENAME} stable” | sudo tee /etc/apt/sources.list.d/influxdb.list
- sudo apt-get update && sudo apt-get install influxdb
- service influxdb start
c3.js
- download c3.min.js,d3.min.js,c3.min.css…
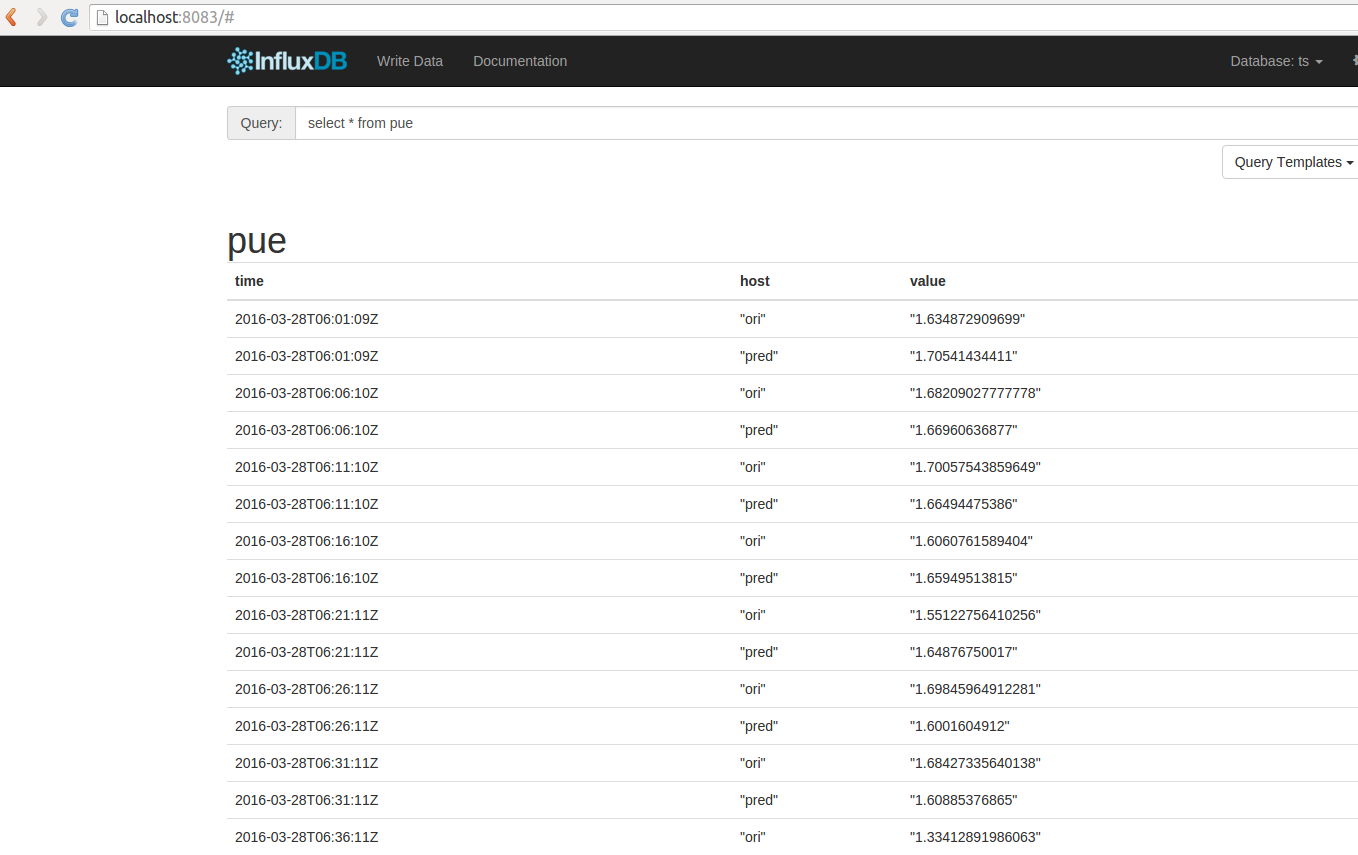
InfluxDB’s content

views.py1
2
3
4
5
6
7
8
9
10
11
12
13
14
15
16
17
18
19
20
21
22
23
24
25
26
27
28
29
30
31
32
33
34
35
36
37
38
39
40
41
42
43
44
45
46# -*- coding: utf-8 -*-
from django.http import HttpResponse
from .models import Greeting
from django.shortcuts import *
from django.template import RequestContext
from django.http import HttpResponseRedirect
import json, time
##
from h import timeSeriesDB
from h import pe
##
#
def index(request):
tsDB = timeSeriesDB.tsDB()
x1,d1,x2,d2=tsDB.read_data()
print("Result: ", d1 )
chart = [ x1,x2,d1,d2 ]
return render(request, 'index.html',
{'chart_columns': json.dumps(chart),'a': 23.53,'b': 1,'c': 12.8,
'd': 26.075,'e': 72.325,'f': 1,
'g': 1.7,'h': 0,'i': 30.8})
def search(request):
a = request.GET['a']
b = request.GET['b']
c = request.GET['c']
d = request.GET['d']
e = request.GET['e']
f = request.GET['f']
g = request.GET['g']
h = request.GET['h']
i = request.GET['i']
a = float(a)
b = float(b)
c = float(c)
d = float(d)
e = float(e)
f = float(f)
g = float(g)
h = float(h)
i = float(i)
X = [a, b, c, d, e, f, g, h, i]
y = [1]
Xy_predict = pe.Online_One_PE(X,y)
return HttpResponse(str(Xy_predict[0]))
index.html1
2
3
4
5
6
7
8
9
10
11
12
13
14
15
16
17
18
19
20
21
22
23
24
25
26
27
28
29
30
31
32
33
34
35
36
37
38
39
40
41
42
43
44
45
46
47
48
49
50
51
52
53
54
55
56
57
58
59
60
61
62
63
64
65
66
67
68
69
70
71<!doctype html>
<html>
<head>
<meta charset="UTF-8">
<title>Time Series Data Visualization</title>
<script src="/static/jquery-1.12.2.min.js"></script>
<!-- Load c3.css -->
<link href="/static/c3.min.css" rel="stylesheet" type="text/css">
<!-- Load d3.js and c3.js -->
<script src="/static/d3.min.js" charset="utf-8"></script>
<script src="/static/c3.min.js"></script>
</head>
<body>
<div id="chart"></div>
<p>INPUT</p>
<form action="/add/" method="get">
Mean cooling tower leaving water temperture: <input type="text" id="a" name="a" value=> <br>
Zone pumps number: <input type="text" id="b" name="b" value=> <br>
Mean zone pumps leaving water temperture: <input type="text" id="c" name="c" value=> <br>
Mean cooling container temperture: <input type="text" id="d" name="d" value=> <br>
Mean cooling container humidity: <input type="text" id="e" name="e" value=> <br>
Chiller DPS: <input type="text" id="f" name="f" value=> <br>
Chiller DPT01: <input type="text" id="g" name="g" value=> <br>
Chiller compressor number: <input type="text" id="h" name="h" value=> <br>
Total it pw: <input type="text" id="i" name="i" value=> <br>
<p>RESULT: <span id='result'></span></p>
<button type="button" id='sum'>Submit</button>
</form>
<script>
$(document).ready(function(){
$("#sum").click(function(){
var a = $("#a").val();
var b = $("#b").val();
var c = $("#c").val();
var d = $("#d").val();
var e = $("#e").val();
var f = $("#f").val();
var g = $("#g").val();
var h = $("#h").val();
var i = $("#i").val();
$.get("/search/",{'a':a,'b':b,'c':c,'d':d,'e':e,'f':f,'g':g,'h':h,'i':i}, function(ret){
$('#result').html(ret)
})
});
});
var columns = ;
var chart = c3.generate({
bindto: '#chart',
data: {
xs: {
'ori': 'x1',
'pred': 'x2',
},
xFormat: '%Y-%m-%dT%H:%M:%SZ',
columns: columns,
onclick: function (d, i) { /* ... */ }
},
axis: {
x: {
type: 'timeseries',
localtime: true,
tick: {
format: '%Y-%m-%d %H:%M:%S'
}
}
}
});
</script>
</body>
</html>
Show

